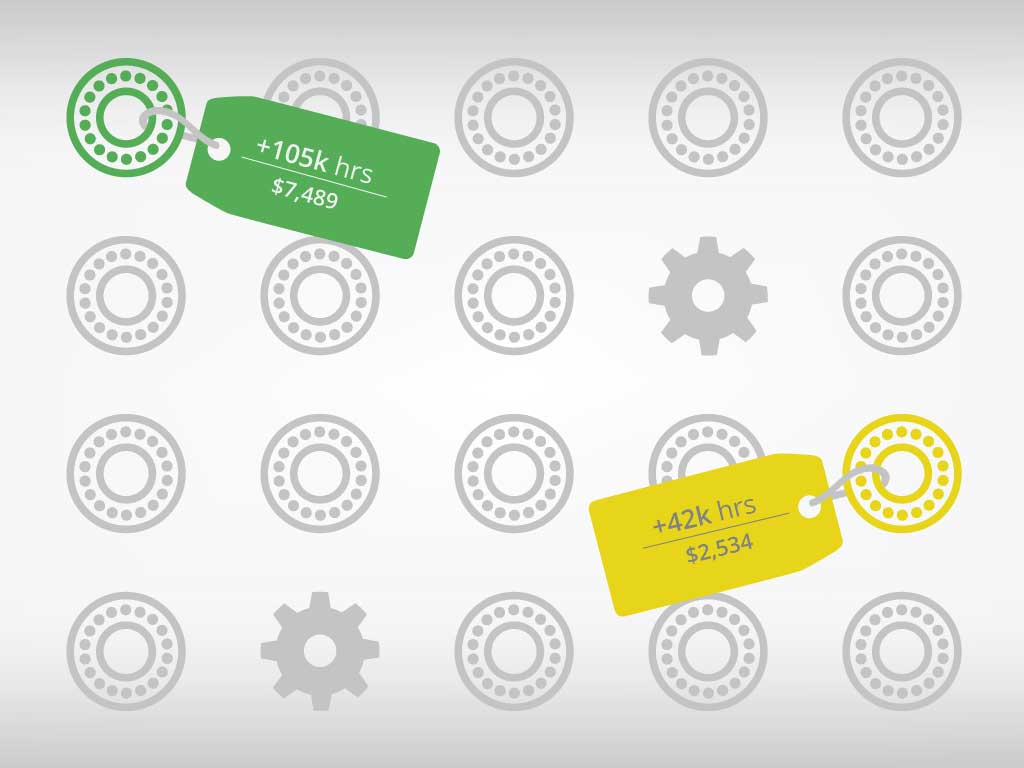
Sentient Science’s Computational Tribologist, Elon Terrell, PhD., leads the discussion on comparing bearing performance and failure rates within the new DigitalClone computational testing solution. We compare the performance of 3 unidentified bearing OEMs and display the weibull comparisons. DigitalClone can be used to compare bearings, gears, gearboxes, and drivetrains within a software environment to accelerate testing and get new products to market faster. We examine the different failure modes and look at potential changes to improve component life.
Recording Transcription:
Natalie: All right. It looks like we have the majority of our attendees on at this point, so I’m going to ahead and get started. Again, thank you all for joining us for the presentation on our DigitalClone Live Demonstration. We’re very excited to have you all here. This is our first live demonstration, and we’ll be going over the 1.5 MW Class Gearbox and we’ll be discussing several Life Extension Options for this application.So, for those of you who don’t know me, I do see a lot of familiar faces on the registration list, but my name is Natalie Hils, I’m the Director of Revenue Marketing here at Sentient Science. My information is here on the screen, so please feel free to reach out to me at any point in time. I have lots of different resources that I’d be happy to pass on to you.
Just wanted to go over some of our webinars that we posted over the past year now. We host one per month and we do three per quarter, so we typically start with a Prognostic Technology Approach which we’re doing today and we go into a deep technology discussion about what goes into our models and how they work. Then we’ll take it into a Life Extension Application, so here we’ll talk about exactly different applications that we can apply our technology to. So it might be an application in the wind industry like we’re doing today, or in the aerospace industry, or several other applications. Finally, we want to tie it all together with a discussion on the Industrial Internet.
All of these webinars are hosted on our website and we do have the recordings and the PowerPoints available for you at any point in time. So again, please feel free to reach out to me if there is a certain one that looks of interest to you and I’d be happy to send you over a direct link. Also on the screen is our next two upcoming webinars, so I will be sending out notifications directly to you for those, but if you want to get some more information on them they are on our website under Upcoming Webinars.
During the presentation we really encourage a two-way conversation so there is a questions box on the right-hand side of your screen. Just type in the question and go ahead and press Enter, and then we’ll have some time at the end to talk to Dr. Raja Pulikollu on those questions, and we will also go back and forth and ask you guys some polls questions throughout the session just to get your input and to understand how to go forward with that presentation.
So, now, I’d like to pass it over to Edward Wagner. He is our Chief Digital Officer here at Sentient. He handles a lot of the product development and works closely with our customers to understand their needs. So, without further ado, Ed, please take it over.
Edward: Natalie, thanks so much. Will you pass me control, please? And welcome, everybody. We’ve been having a good time with these webinars. I hope you’ve enjoyed listening along with us. Today is the first time we’re doing kind of a report out on our 1.5 finding so there won’t be any proprietary information here, but we’ll kind of give you an assessment of where we are. This is the bulk of the North American fleet so I know people have been waiting for our report out on this. Next slide, please, Natalie.
So, Sentient has been engaged with about almost 30% of the North American fleet, wind fleet at this time. And the thing that we’re hearing is about, “What if I had more time? What if I were able to figure out things with more time?” And although I’m being a little campy down on the bottom left, we are talking about what would happen if you were able to assess the condition of your, in this case, wind turbine gearboxes, but other rotating components earlier than you could do today. And what would you do with more time? Next slide, please.
And so that theme of saving time and giving more time is really the theme of our company. So I just want to go back for those of you who don’t know about Sentient, maybe this is early for you and some of you have heard our story. We were born out of about $25 million in competitively won SBIR contracts starting with DARPA, looking if they could, or we could, figure out crack initiation and nucleation early in rotating net components as a way to drive down service costs. Those early contracts were put in place for us to develop the technology. It took us 10 years in the lab to work on this and validate it. And over that period of time, we had the chance to deploy on Black Hawk and Apache, NASA, a number of DoD programs which then got us into the DOE programs work that we did on clip board gearbox.
But what’s unique is that our orientation really was we were working with the operators to build out DigitalClone and the things that we’re talking about today. We were working principally with people who don’t have a lot of data and they really needed to understand what bill of materials they had in their systems, what was the remaining useful life of those component systems. And so I just want to reiterate that our pedigree is strong from the work that we did under DoD programs, but that we also began our company and worked very closely with the operators to make sure that we were focused on their requirements before we actually transitioned to talk to the OEMs and the supplier channels. Next slide, please.
Whereas, those of you who know us know this slide, hopefully it’s not too new. The work that we pioneered was really in the area of crack nucleation initiation on these rotating metal components, bearings, gears, gearboxes, drive trains. By the time that crack is far to the right, that’s in long crack growth, we’re really in the operational failure of the various systems that we’re talking about. By that time we’re really kicking the diagnostic systems that are in the market, there are plenty of them. But where we focused our attention is before that, and if we could provide to the operators insight, early detection into crack nucleation and the mean time to observable damage on the bearings and the gears, what would they with that information?
And so from a corporate point of view we take a lot of time to differentiate our approach, our technical approach which is prognostic-based not diagnostic-based. We make predictions and then we use the diagnostics to validate those predictions. The way we do that is through material sciences, that’s the core technology. We look down at the material, we load up those materials, we run them through high-performance computing, we look at the trackology [SP] going on with those various components. But we’re really a material science-driven company. Again, we’re focused on giving the remaining useful life information back to our customers. We will uncover the mean time to observable damage on those bearings and gears, we’ll do it computationally and then we’ll map that to the diagnostic information that the customers have and try to come to operational failure predictions.
And, of course, since we’re in a simulation environment we can do all kinds of tradeoff studies. What if you use one bearing versus another? What if you use one lubrication versus another? What’s the impact on the remaining useful life? And so this is what our company has really been working on, and what we do is we model up these systems and then we test them. And we test them all day, all night, and we look for changes that are going on in the field that would impact our predictions. Next slide, please.
So, our technical approach is outlined in this cute graphic, and I’ll compare that against diagnostics in a moment. We start with a prediction, this is what our core technology allows us to do. We model up these systems, we predict the mean time to observable damage on the bearings, gears, gearboxes and drive trains, and we do that fairly quickly. That’s our core technology. Then we will acquire a signal, either through SCADA, or hums, or through manual means if we have to, to confirm that prediction, the things that go on naturally out in the field and we need that data brought back in so that we can confirm our predictions.
And then we have the ability, because we’re in a simulation environment, to recommend changes in operating conditions, recommend changes in components. In some cases, like UABs we’ll actually push changes in operating parameters to the UAB as a control segment which is the most valuable thing that we do which is to make recommendations or tell our customers the changes we recommend to extend life. This is our construct. We predict, acquire, confirm and control. Next slide, please.
And that is differentiated against the diagnostics world today. We all know the amount of information, sensors, overhead analytics, storage and work that has to go on in a traditional diagnostic approach. This Bell curve has been going on for 15-20 years, we know this pretty well. We have a pretty good idea of the costs of getting to predictions using diagnostic methods today, and looking for changes in those predictions. And that is our benchmark against what we’re doing in the prognostics world where we can predict first and then use the diagnostic systems, the onboard diagnostic systems, to confirm our predictions.
We do this using multi-physics material models as we talked about. We build a digital model and then we run high-performance computing simulations, some of you know at the University of Buffalo is where we’re running those, and then look for exceptions to those predictions as we acquire and confirm the signal. It is a software capability, we serve it up as a SaaS, and this is what we’ve been bringing to market, first in the energy space, the industrial space and the defense space. Next slide, please.
Again, sorry to be so long-winded, I just wanted to front end before Raja talks about the work we’re doing in the 1.5 Gearboxes. But this is the business problem we’re trying to solve. In our customers today, they have plenty of diagnostic systems they tend to do a good job, but you’re very far along the failure curve when those diagnostics tell you that something is failing. Our claim to fame is that we can figure out crack nucleation initiation much earlier, give that information to you and give you options to extend the curve, extend the failure point out so that you can extend the life of these gearboxes and various other systems that we’re working with. Next slide, please.
To be specific in the wind space we’re providing these six reports that look like they provide the core value to our customers. I’m just going to read down them and give you an idea and you can tell me how you value them. First ranking, fleet-wide, across the fleet, all the gearbox access worst to best, and principally we’re looking for things that are not on your watch list today, and we’re finding those are very high value because those are the surprises that you don’t want to have. Number two, we’re looking at all the gearbox candidates that can be modified up-tower. We calculate the critical components in order of what we believe their failure rates will be, and then based on your changing them, we’ll do new life-ing predictions post-replacement because it’s not about replacing an individual component or a lubrication. It is, “Did you extend life of the gearbox itself?” And then, of course, in the application, for those of you who’ve seen it, there’s an ROI capability to assess did you make any money at doing that.
Number three, here’s a list of all the gearbox candidates that you may want to de-rate. In some spaces, you don’t want to de-rate but if you need to, to extend gearbox life, we can provide the report on the units that should be de-rated, what should their optimal power levels be, and what the return on investment model would look like to extend that life. Number four is we look at the life-ing options and predictions for any of the upgraded gearboxes, gearboxes that you want to get more power out of, what will be the impact on the life of the gearbox? Number five, we tend to take in the as-is bill of materials, and those of you who have seen the software you know that we have a copy of the bill of materials that we might take out of Maximo, we put it into DigitalClone, we do our simulations and our recommendations, and then we return to you to-be or the optimized bill of materials so that you can decide whether or not you want to create work orders or engage your suppliers.
And then, ultimately, when you take all these things together, our customers are asking for budgeting plans, and we’re now able to calculate at least five or maybe even out as far as 10-year budgeting plans based on the information above to estimate spend per site. So if I look at all the things that we’ve been providing to the North American wind market, it really is very clear that the owner-operators are asking for these six reports and this is what we’ve been doing.
So, now you’ve heard long enough about me and a little bit about Sentient and what our shtick is. I’m going to transition over to Dr. Raja Pulikollu, but before I do, in these webinars we’ve got questions for you so you can be an active participant, and we’ll just call this a polling question, and I want to ask you your first polling question today. Can you think of an example when if you had more time you might’ve prevented a significant failure? Now, we all have them. I’m just interested in what you think. And would you please run that poll and we’ll give the guys about 30 seconds please.
Okay, Natalie, how are we doing?
Natalie: I just closed it. It looks like we have 70% who said, “Yes, I have a lot of examples.” And we have 30% who said, “I’ve never run out of time.” And nobody wants to go on holiday on that, I’m not sure why.
Edward: All right. This is a little campy but we do like to get feedback from you guys as we’re having these webinars.
So let me transition to Dr. Raja Pulikollu who’s our Director of Implementations in our Chief Material Sciences. Many of you have met Raja on these webinars or maybe out in the field, and we’ll drive into some of the results that we have on the 1.5. So, Raja, are you on?
Raja: Yes, I am. Can you hear me okay?
Edward: We can hear you fine.
Raja: Okay. Good. Thanks. [inaudible 00:17:12] my background while we’re taking the polling question. I like that.
Okay, so before getting into the slide deck, I just want to give you a brief overview on what you can expect in the next 30 minutes. So at first, we are going to cover the prognostic technology, how we differentiate that with a data-driven model, followed by a brief DigitalClone Live demo, and as Ed mentioned, there is no real site data. It’s all made-up numbers for this demo, so we are not using any customer information. And at the end of this slide deck we are going to show a few customer examples, use cases, where we have successfully demonstrated this technology in solving real problems, site problems, and also how we helped our customers to increase their written-off investment and budget and planning. So, with that said, Natalie, please go to the next slide.
So this slide is an overview of our prognostic model and how we differentiate this with the data-driven model. So the input for this physics-built prognostic model includes the turbine operational data, SCADA, metal work and any other information that sites can provide so we can use that to build the model, and also the bill of materials information, the geometry details of the components inside the gearbox, and of the type of oil used for the gearbox. So all these are direct inputs for the prognostic model, and using this information we’ve developed a multi-body dynamic model of the full gearbox, as we can see on the slide towards the bottom right.
And given the turbine operational data, we calculate the forces and moments acting on the main shaft, and then we translate these forces and moments onto the individual components to calculate the local stresses on the components and also the life. So this is how we calculate the life of a gearbox by linking the turbine operational data with the gearbox, forces and loads and stresses on individual components to the life of the gearbox. Next slide, please.
So, using this information, using the prognostic model, we can differentiate the quality of various suppliers of the gearbox. So, in this example case, we have developed prognostic models for four different suppliers of the gearbox, and in this viable plot, you can see the failure rates of each of these suppliers. So the x-axis is the operational hours and the y-axis is the probability of failure, and because we look at the bill of materials, we look at the individual geometries and we differentiate one gearbox with respect to the other, that is why we are able to provide life predictions on various suppliers, do it for the same gearbox type but we can differentiate the supplier quality using prognostic model.
And as we can see from these plots, on an average you can expect to start seeing failures on this 1.5 Gearbox that are on 7 to 8 years on an average, depends on the site, and you can expect to see an increase in operational maintenance costs from 7 years and above, so you can expect relatively higher failures around 10 to 12 years’ timeframe. Okay. So obviously the goal here is to reduce the failure rates and also improve the original investment, and also help customers to schedule preventive maintenance rather than corrective maintenance.
So, with that said, we have various life extension options that are listed here on the slide that we work with the customers in implementing these life extension options on site, which includes uptower replacements, gearbox upgrades, whether de-rate or up-rate or change in oil, and also this information, we can also help the customers in terms of their budget planning and purchases of various components that are needed such as the components that are not required. And, as I’ve said, preventive maintenance rather than corrective maintenance that saves a lot of money. And also while replacing either a gearbox or individual components, but before selecting a supplier, we can work with the customers in terms of identifying the right supplier that meets their design and operational requirements. So we can also do the sensory analysis of comparing one supplier with the perfect [inaudible 00:23:42]. Next slide, please.
So through our prognostic model we identified what are the critical components leading to gearbox failure for 1.5 MW turbine. So the primary damage mode in most of the cases is due to bearings, so primary bearings, low speed intermediate shaft bearings, and high-speed shaft bearings that may lead to secondary damage due to the misalignment caused by the bearing play. So two slots on planetary gear messing with the sun gear due to the planetary bearing significant pitting and spalling, low-speed shaft and intermediate gear meshing failure, followed by ring gear and others. So the primary damage mode that we have seen and predicted, 1.5 MW is mainly due to bearings. And the following slides we can discuss on how we can extend the life on the critical turbines. Next slide, please.
So, the most significant life extension option in terms of diagnostic investment is the up-tower replacement. So on an average if you spend, let’s say, 40K, then you can save 700K on the gearbox, and it purely depends on having find the right critical component and also scheduling the replacement before it’s too late. So with DigitalClone we can list the turbines, the most critical to the least critical, that needs up-tower replacements, and also what are those specific critical components that needs to be replaced to extend the gearbox life. And the customers can also go with the product and they can do analysis of [inaudible 00:26:12] the up-tower component and how it affects the gearbox life and the return on investment so that they can make a judgment call. So this is a very important feature in our product that our customers have been successfully using and able to extend the life and provided a lot of savings for all of our customers. Next slide, please.
And the second life extension option is de-rating a turbine. And, again, we are talking about based on specific turbines, based on its current health state. In this example case, the damage was noticed on a bearing due to significant amount of pitting and spalling that customer have provided us images that they have taken using borescope and they provided us their inspection records, and using that, plugging this into our DigitalClone model, we recommended the customer a 20% de-rate, which is 1.2 MW, and recommended the customer to schedule inspection of the gearbox after two to three months. So the customer in this example case was expecting the gearbox operational failure in a month, but with this de-rate recommendation we predicted an extension of nine months in life.
And when the customer scheduled the inspection after three months, they have seen the damage have been…the damage progression has stopped and they have not seen the failure as they have expected in a month. And now we’re already into the seven-month of this turbine and it is performing fine. So in this case the de-rate recommendation worked great for this turbine. So this is just one example but we have applied this technology on many other turbines for many of our customers. So not only bearing but if there’s a damage on a gear, a one tooth loss or two teeth loss, we can insert that damage into our prognostic model and we can provide an accurate de-rate recommendation. Next slide, please.
So this slide shows a quick summary on how we provide the de-rate recommendation. It’s physics-based, as I said, it’s not data-driven, it’s physics-based model. In this specific example, the radial clearance on the bearing due to pitting and spalling is around 1.5 mm. So if you go to the plot what we are showing here is the x-axis is the power output, zero to 1.5 MW, and the y-axis is the fillet stresses on the gear. So due to the bearing damage, we can expect to see the gear misalignment that may lead to significant increase in the fillet stresses. So that’s what you are seeing in this plot. So the green line shows a healthy gearbox, the stresses on a healthy gearbox which are way below the endurance limit.
Whereas the black, yellow and red lines, they show the fillet stresses on the gear due to bearing damage, the increase in the damage on the bearing leading to the gear misalignment, and you can see the stresses going up. So with a bearing clearance of 1.5 mm, if the turbine continues to operate at 1.5 MW then the damage is going to continue to progress leading to potential failure. As we can see the stresses are above the endurance limit. However, if we de-rate that to 1.2 MW, as we can see the crossover point here, then the stresses are going to stay below the endurance limit that means the damage progression is going to slow down. So based on the physics-based model, in this specific example, we recommended the customer a 1.2 MW de-rate, and the de-rate was implemented in the field, and the life was successfully extended by nine months, whereas the customer was expecting the turbine to fail in less than a month. So this is one successful demonstration of the de-rate example. Next slide, please.
Okay, so not only de-rating but also uprating. So some of our customers they are looking at options of uprating a turbine, 1.5 MW one. So we can do the sensory analysis using DigitalClone, what would be the effect of uprating on return on investment and also the failure rate. In this specific example, there’s a 2% uprating, we’re going to see a slight increase in the failure rate by 4%. However with respect to the result of investment is a good option because, as you can see, if increasing the return on investment, there’s a slight increase in the failure rate. And if you go to the next slide, if you uprate the turbine to 5% then there is a drastic increase in the failure rate, so that will reduce your return on investment. Okay, so in this example, further uprating is not a good approach. So using this DigitalClone, we can tell the customer based on their site-specific conditions and requirements, we can provide recommendations on uprating, keeping the failure rate under control, and also increasing the return on investment. Next slide, please.
So, so far we have discussed on gearbox, applying DigitalClone for gearbox. So connection to that we also work on main bearings for 1.5 MW. In this specific example, the customer was interested in [inaudible 00:33:43] what the baseline life analysis versus life extension. So for life extension the customer was considering looking at the change in oil and also a better surface finish. In this case, for the baseline of the L10 Life is around 7.6 years and with the change in oil to a better oil, the life is expected to increase to 10 years. And with just Superfinish, the life is expected to increase 13.7 years, and overall with the combination of better oil and Superfinish, the life of the Super Bearing is going to be 18.4 versus 7.6.
So, overall, the life of the main bearing can be improved by a factor of 2.4 by using better oil, and also by using better surface finish on the main bearing. So DigitalClone cannot only provide the life prediction on as-is condition but also to-be condition. So you can do the sensory analysis by changing the oil, or surface finish, or different geometries, or different suppliers, and the product will give you the best option to meet your business needs. Next slide, please.
Natalie: So, Raja, we’re just going to take a brief break here and ask the audience a poll question at this time.
Raja: Sure.
Natalie: Wait just one second, I’m having a little difficulty, but it looks like I have the poll up now. And the attendees are viewing the poll. So, at this time I’m going to ask the audience, are you budgeting for gearbox replacement costs retroactively based on historical data, or proactively based on projective fleet failure rates? And I have a few options listed there, “Yes, I am budgeting retroactively,” “Yes, I am budgeting based on projected fleet failure rates,” and, “I don’t know yet. I may need help.” So I’ll give you guys just a few minutes to answer that question, and we’ll get started with the presentation again.
All right. Sorry about that. I didn’t think the right question was viewing for some reason, but it’s now up so I’ll give you guys just a few more seconds there to answer that. I apologize about that.
All right. I’m going to go ahead and close the poll right now and share the results. So it looks like about 44% said, “Yes, I am budgeting based on projected fleet failure rates,” 28% said, “I don’t know yet and I may need some help,” and 28% also say, “Yes, I am budgeting retroactively.” So I’m going to go ahead and hide that and pass the controls back to Raja, and go ahead and take over.
Raja: Thanks, Natalie. Can you please share the slide deck?
Natalie: Yes, just one second. I apologize about that.
Raja: By the way, it’s good to see radically higher percentage on projecting based on future failure rates, so that’s good to know.
Natalie: All right. It looks like you’re all set, Raja. Go ahead.
Raja: Okay. Thank you. Before getting into the demo, we just want to give an overview on how DigitalClone computational model can be integrated with customer database. So by input to DigitalClone computational model as we discussed, it includes bill of materials and other site and specific information. So we can get that information from Maximo or integrating with any other database that customers use. So once this data fits into DigitalClone, we’ll run these simulations on clusters using the resources that we have with the University of Buffalo.
We have multiple processes to run the simulations and manage the fleet and asset controlled by seven. And predicts information, as we discussed, to the reports that Ed went through, and also the life extension option and the live predictions that I went to, so it provides latest reports. And these reports specific to each asset and site can be integrated with customer-specific systems and work orders that they can use for their budget planning and parts inventory and other applications. Next slide, please.
So we’re going to go through some of the snapshots of our product, and we are only going to cover some of the highlights, but you can get more information once you get access to the product. So this is the login page. So once you log in, then the customer can see their entire fleet, where their sites are located as per the GPS locations on the map, and also towards your right you can see a quick summary of the fleet health, listing the most critical, shown in red, to healthy gearboxes shown in green. So this is like an admin view giving you an overall picture of the entire fleet of the customer. Next slide, please.
So, at the fleet level, a customer have access to the fleet report listing the worst to best turbines based on their current health state. So if the customer have information on these specific assets, if they have information on the sensors, then they can also integrate that into our software for each asset, and we can see it also list what the mean time of observable damage and what the power output that is currently running at, is it de-rated or uprated. And also for this specific asset, what is the worst component that may lead to potential failure? So this fleet report provides a list of critical assets with the mean time to observable damage and what the critical component. Next slide, please.
So, now, going into the individual site level from the fleet level. So, in this case, we’ve selected site two and we can see the site level report, again listing the turbines from the most critical to the least critical on the left with their mean time of observable damage life, and also on the extreme right you can see the fleet health. And in the map you can see the location of the critical turbines versus a healthy turbine. Next slide, please.
So, now, we are looking at the site level report. In the site level report, we’ll list the top three most critical assets that need immediate attention, and also at the site level, we’ll list the turbines from the worst to best including information on the life left and the worst component, similar to the fleet level report but here we are looking at the specific site and what the life left on each of these turbines on this specific site. Next slide, please.
Now, we are going into the individual asset and gearbox level. So, in this example case of this specific gearbox, we have listed the bill of materials in this specific gearbox and who the supplier and the location of this component and when it was installed and if there have been any up-tower replacement, then it will be included in this asset level report so the customer can go and do the up-tower replacement analysis at this specific location of the product. If they change, let’s say, a bearing, a damaged bearing, with a better-quality bearing what the life expected due to this up-tower replacement so they can do the tradeoff analysis. Next slide, please.
So at this specific asset and gearbox level, we have also included the power flow schematic of the gearbox, identifying the critical component and its location in the gearbox. So this would help customers if they do borescope inspection or if they’re looking at the sensor data, this would help the customers in terms of focusing on a specific component and confirming our prediction with their site observations. Next slide, please.
So, now, at the individual asset level system report we list all the critical components, from worst to best, and also what the life left and when this was originally installed, in addition to that for the specific gearbox, what are the top three most critical components. This would help the customer in terms of scheduling the up-tower replacement. So if the critical component is something that they can do, an up-tower repair, then that would help in extending the life of the gearbox and also providing savings on replacement of the gearbox. They can just do the up-tower replacement and provide a lot of savings. Next slide, please.
So, now, looking at the individual component. So, initially, we started with fleet level, then we went to the site level report, from there to the individual asset level report, and we did a system level report, and now we’re at the individual component level report. So the individual component level report will include information about the life remaining on this specific component and what’s the current damage state when this was originally installed, if it will be replaced, what would be the life extension. Next slide, please.
So, coming to the system level return on investment and tradeoff studies using DigitalClone, so we have already covered a few examples showing where the life extension options. Everything is integrated in the product, so the customer can run the tradeoff studies using the product live, and the product will view the best life extension option, it could be de-rating or uprating based on return on investment, or it could be also up-tower replacement. Next slide, please.
So in one of the previous slides we looked at the de-rate option based on site observations. So the customers can go into the product and they can upload their borescope images, identifying the type of damage, and also when this inspection was made on the turbine, and zero being no visible damage and four being severely damaged, so they have an option of ranking the gearbox health state based on the specific component damage. Once they enter this information, the product will provide the best de-rate option linking that to the return on investment and the life extension. Next slide, please.
So this is just an example report providing the life extension option for the entire fleet going from one asset to another. So this helps the customers in terms of reducing their fleet failure rate and extending the life of the critical assets, and also providing improved return on investment. So all this information is provided in the fleet-wide life extension report. Next slide, please.
So we’ll quickly go through some of the case studies that we did for our other customers. In the past example, on this specific 1.5 MW turbine, Broadwind has made upgrades to the gearbox and they want to quantify the upgrades that they made with the baseline gearbox model. And it takes a lot of time and effort and also a lot of money to test that, using test with. Instead of that Broadwind had used DigitalClone to virtually test the improvements and quantify the improvements of their changes to the gearbox. Next slide, please.
So for this specific case study we have selected a Class 1 Severe Site, and in this viable product we have compared the baseline gearbox versus the DriveMAX improved gearbox. So, overall, the life of the gearbox has improved by a factor or three, with the improvements that Broadwind has made to the gearbox, to the sun gear and also the planetary bearing. So this provided significant savings in extending the life of the gearbox. Next slide, please.
In this another example for AeroTorque they have a new product called Control that could potentially reduce the overload and torque events and preventing the white etch formation on the bearings. But the problem here is, “How can they quantify the improvements due to this torque control on 1.5MW turbines?” So using DigitalClone we have selected a few sites and we did the life extension analysis on the 1.5MW Gearbox with torque control versus without torque control, and overall the life improved by a factor of two because this torque control has reduced the overload, over torque conditions. So we have shown significant savings with this new product by AeroTorque. Next slide, please.
So, with that, I would like to hand over the presentation to Ed and Natalie.
Edward: Raja, thank you. So I know we cut through a lot of ground and certainly we’re running out of time. Contact us if you have any questions on that information. We can drill down lower. Just as we’re summing up now, this is how we’re seeing DigitalClone being used in various places. In the red, we’re being asked for inspections and budgets and optimized duty cycles, but most specifically what components are going to fail in what order and where, as input into the inventory supply chain systems, maybe Maximo or SAP or some of the analytic systems, which then are feeding the fleet optimization systems that are out there to do a better job across the fleets, which are then feeding the OEM aftermarket to do a better job in the various repairs and upgrades and that’s flowing back to us. So if you see how this integrated circle looks like, our position in the market is to make sure that you have the best information as soon as possible, as early as possible to feed those systems. Next slide, please.
I didn’t want to leave you with the impression today that we were only working on helicopters. Obviously our pedigree at DoD. This is DigitalClone Live for the ASTRO program of the Apache helicopters, next slide. And because of that work that we did at Boeing, Boeing signed a four-year agreement with us on the ASTRO Drives Systems, we’re very proud of that, being able to extend the life of the tail rotor gearboxes. Okay, next slide, please.
We have a couple of questions from the field, and we just have a couple of minutes. Natalie, if you want to read off some of those questions, we’ll see if we can field them and then we’ll adjourn for today.
Natalie: Yeah, absolutely. Thank you, Ed. So for our first poll question I have, “How do you determine the effect of different lubricants in both the gearbox and main bearing?” Do you think this question should go to Raja?
Raja: Sorry, what was the question?
Natalie: Sure. So I’ll just repeat it for you. How do you determine the effect of different lubricants in both the gearbox and main bearing?
Raja: Yeah. So, DigitalClone includes the mixed hydrodynamic lubrication module, so using that along with the input such as the oil properties, [inaudible 00:55:58], the density, operating temperatures, along with the type of surface finish, [inaudible 00:56:06], clean-up factor. So by using all these as an input to the HEL model, by taking the concentration, the roller and the [inaudible 00:56:19] profiles we can differentiate the performance of the main bearing versus the gearbox bearings.
Natalie: Great. Thank you, Raja. And, Ed, the next question is for you, and it’s, “Do you install condition monitoring systems?”
Edward: So our point of view is that we could do much of the predictions through material sciences, that’s obviously why we exist. And so those of you who have the condition monitoring systems, the diagnostic systems in place, we’ll use that data to validate the predictions, I think that’s a good idea. But for those of you who don’t, especially on the larger fleets because they’re so costly, we’re engaging with you so that you can get the predictions without those systems in place. As you get closer to operational failure, obviously those systems will override our prognostics because we may calculate a certain period of time that you’ve got to…for a variety of reasons. You’ve got an operational failure that’s happening, and you know it through your predictions and diagnostic systems, and we use that information to do a better job in our calculations.
So, that’s a long answer to say no, we don’t install condition monitoring systems, but in the complex cases where you need a vibration monitor, we have been known to get in there only to validate the predictions that we’ve made in DigitalClone. Next question, please.
Natalie: Great. Thank you, Ed. It looks like we’re just running out of time here, but I have one more question, and again, anyone in the audience, if you have more questions for us please feel free to input them into that box. I do get those after this session and we can reach out to you individually. So the last question is, “You guys showed a lot of examples for 1.5 MW machines, but can Sentient provide predictions for any type of 1.5 MW machine?”
Edward: So just a general statement, we have a recipe for building these gearboxes and we don’t care if it’s a 1.5, or if it’s a Vestas machine, or if it’s a 2.0 Class machine. It happens to be the bulk of the fleet of the 1.5s in North America, so we’re focused there. And as you know, there’s a whole series of gearbox suppliers for that, and we’re taking them down in a certain order, the biggest first and then down to the smaller ones. So if you’re interested in our product development roadmap and the rollout of the various gearboxes and OEMs I can go through that. Contact us directly and we’ll setup some time to review that. But there’s no reason that Sentient can’t take on the various gearboxes. In fact, we created the simulator to be a horizontal simulator not just to be used in wind and renewables but also in other areas of energy, industrial segments and DoD, so we have a lot of examples of using that simulator today.
Any others, Natalie?
Natalie: I do. I have a few more. Do you want me to go through just a few more?
Edward: No, let’s be respectful of people’s time. So we will return those questions with the answers directly to you. Again, thank you for your time today. And if we can answer any questions regarding the presentation today please contact us, we’d be glad to do so. That’s why we’re in business to answer your questions and to help out. Back to you, Natalie.
Natalie: Great. Thank you, Ed. And thank you all for joining us. I see a lot of new faces online, so thank you for coming on. And I just want to again, invite everybody to our next webinar series. So we will be presenting on different bearing options and how you can purchase them through different suppliers and understand the life of these and not just purchasing them on cost. So we’ll be hosting that on September 16 and we’ll also have another one on October 14 regarding Full Service Agreements and how we can apply prognostics to negotiate these better. So look for those on our website. I’ll send you guys a direct links as well with further information, and I will send out the recording later this week. So thank you all for joining us today.
Presenter
 Elon Terrell, PhD.
Computational Tribologist
Dr. Terrell is responsible for the development of useful life prediction and optimized system control for DigitalClone System. He holds a Ph.D. in Mechanical Engineering from Carnegie Mellon University, with emphasis on numerical prediction of material wear in unsteady, nanofluid-lubricated interfaces. He also serves as an adjunct faculty member in the Mechanical Engineering Department of Columbia University.